X (Twitter) User Statistics 2026: 60+ Verified Numbers & the Data Nobody Agrees On | SEOScaleUp
X (Twitter) User Statistics 2026: 60+ Verified Numbers & the Data Nobody Agrees On | SEOScaleUp Skip to content SEOScaleUp Users Demographics Revenue Threads & Bluesky FAQ Statistics report · Updated August 2026 X (Twitter) User Statistics 2026 Every major report gives you a different X user number — 557 million here, 611 million there. Instead of picking one and hoping, we compared nine independent sources side by side. Here’s what the data actually shows, with the disagreements left in. 📅 Last updated: Aug 4, 2026 ⏱ 12 min read 📊 9 sources cross-checked ✍️ SEOScaleUp Research Desk M+ Estimated monthly active users Range across sources: 557M–611M M Estimated daily active users (mDAU) Last official figure: 237.8M (2022) B Projected 2026 ad revenue eMarketer forecast, up from $2.26B M Posts sent per day ≈350K posts every minute ⚡ Key takeaways (30-second version) There is no single “official” X user number anymore. X stopped disclosing audited metrics after the 2022 acquisition, so every 2026 figure — including ours — is a third-party estimate. Independent estimates for 2026 monthly active users cluster between 557M and 611M, with most serious trackers converging near 590–600M. X’s ad business is recovering: Q4 2025 was the first ad-revenue-positive quarter since Musk’s takeover, and Q1 2026 revenue grew roughly 17% year-over-year. The platform skews male (~61–64%) and young (25–34 is the largest single age group). Threads (320M MAU) is now a real competitor; Bluesky (~42M registered, single-digit millions daily) is still a niche player by comparison. Grok’s integration is reshaping the platform — its MAU roughly tripled year-over-year and it’s pulling meaningful U.S. AI-chatbot market share. On this page 01How many users does X have in 2026? 02The X user-count discrepancy, explained 03Daily active users & engagement 04Age, gender & country breakdown 05How people actually use X 06Revenue, ads & X Premium 07Grok and the AI push 08X vs. Threads vs. Bluesky 09Frequently asked questions 10Full source list 01 · Users How many users does X have in 2026? Between 557 million and 611 million, depending which report you trust. That’s not a typo — it’s the actual spread across nine independent research firms as of mid-2026. The chart below plots the full historical series, including the years Twitter still filed audited numbers with the SEC. Global X (Twitter) monthly active users, 2018–2026 Solid line = officially disclosed figures (through 2018). Dashed = post-acquisition third-party estimates, shown as a range. Sources: Twitter 10-K filings (2018) · Backlinko · DemandSage · SearchLab · SQ Magazine For context on where X sits among its peers, see our broader breakdown of the top social media platforms in 2026 and our global social media usage statistics report. 02 · Why the numbers disagree The X user-count discrepancy, explained Most “X statistics” posts quote one number as fact. We think that’s misleading, so here’s the actual source comparison — including how confident each figure is, based on the disclosure method behind it. 2026 monthly active user estimates, by source Confidence signal reflects disclosure quality: audited filing (4 bars) → ad-platform API (3) → traffic modeling (2) → single self-reported claim (1). Source Estimated MAU Method Confidence DataReportal / Kepios (ad-reach proxy) 586M Ad-platform self-serve tool SearchLab.nl 611M Aggregated estimate GetAFollower 611M Aggregated estimate DemandSage 557M Aggregated estimate SQ Magazine (revised) 540–570M Blended/revised model Wytlabs 560–570M Independent estimate Famewall 600M Aggregated estimate Last audited SEC figure (Q2 2022, mDAU only) 237.8M 10-Q filing “Confidence” is our editorial rating of disclosure quality, not a claim about accuracy of the underlying estimate. Here’s the honest summary: X Corp went private in October 2022 and has not filed an audited user count since. Every number published anywhere in 2026 — including on this page — is modeled from ad-platform tools, app-traffic panels, or public statements. Treat any single “X has exactly X million users” claim with healthy skepticism, and prefer a range over a point estimate. 03 · Daily activity Daily active users & engagement The daily-active picture is a little more stable than MAU, since it’s less sensitive to inflated total registrations. X’s daily-to-monthly ratio of roughly 41–42% is healthy for a platform this size — well above typical “utility” apps, though behind TikTok-tier engagement. 251–259M Estimated monetizable daily active users (2026) ~41% Daily-to-monthly active ratio 8–10x Average app opens per day, per active user ~30 min Average daily time spent on X ~90% Sessions originating from mobile 100B Post impressions served per day mDAU: last audited figure vs. 2026 estimate Sources: X Corp Q2 2022 10-Q · SocialPilot 04 · Who’s actually on X Age, gender & country breakdown X’s audience skews noticeably more male and slightly older-millennial than Instagram or TikTok. The 25–34 bracket is the platform’s core — likely reflecting its news, finance, and tech-industry gravity. Age distribution Composite of Backlinko, SocialPilot & Charle Agency estimates, 2025–26 Gender split Global estimate, 2026 Top 5 countries by X user base Sources: SocialPilot (Statista ad-audience data) · figures represent advertising reach, not verified logins. Household income skews high: U.S. users earning $75,000+ annually make up 36% of the American audience — roughly double their share of the general population — which is part of why X ad inventory still commands a premium in finance, B2B, and tech verticals despite the platform’s smaller scale versus Instagram or TikTok. For the wider platform-by-platform picture, see our 2026 social media trends report. 05 · Usage patterns How people actually use X X remains disproportionately a “read” platform. A small share of accounts generate almost all the content, while most users are there to consume news and real-time updates rather than post. The 90/10 posting split The top 10% of accounts create roughly 92% of all posts on the platform. Average likes-per-post fell from 37.8 (2023) to 31.4 (2024) as feed algorithms shifted toward video and long-form content. 79% of users follow at least one brand, making X a durable channel for brand awareness even as pure engagement metrics soften. Why people say they use X Users
Data Privacy Statistics 2026: 60+ Numbers on Breaches, Regulation & Trust | SEOScaleUp
Data Privacy Statistics 2026: 60+ Numbers on Breaches, Regulation & Trust | SEOScaleUp SEOScaleUp / Data & Marketing Statistics Desk Report No. 26-DP-07 · Updated Aug 2026 Statistics Report · 2026 Edition What companies collect on you is 86%click to declassify of everything — and it’s costing them $4.99Mclick to declassify a breach. The complete, sourced data privacy statistics report for 2026 — regulation, breach costs, AI-driven risk, and what consumers actually trust — visualized with live charts, not just a wall of bullet points. 62 data points · 7 primary sources · Last verified August 4, 2026 $0M Avg. global breach cost, +12% YoY 0 Data compromises in H1 2026 alone 0M Victim notices in H1 2026, already > all of 2025 0% Of Americans worried about online privacy Every marketer citing a “data privacy stat” in 2026 is quoting one of two things: an IBM press release or a LinkedIn post about GDPR. Both are usually a version out of date. Since March, the average breach has gotten more expensive, the number of countries with real privacy law has kept climbing, and generative AI has become the single fastest-growing source of privacy risk inside the enterprise. This report pulls the current numbers from primary sources — IBM/Ponemon, the Identity Theft Resource Center, ISACA, and Cisco’s 2026 privacy studies — and puts them next to each other so you can see the shape of the year, not just isolated headlines. Every chart below is interactive; every stat links back to where it came from. Contents Global regulation, 2026 Breach cost & frequency AI-driven privacy risk Consumer trust & behavior Who collects the most data Inside enterprise privacy programs FAQ 01 · Regulation Privacy law now covers 4 in 5 people on Earth Legislation is the backdrop every other stat in this report sits against. It’s no longer a Europe-only story. Share of world population under a privacy law Source: Secureframe / ISACA, 2026 Jurisdictions with data protection law179 / 240 People covered worldwide~80% Cumulative GDPR fines since 2018€5.88B GDPR fines added in past 12 months€1.2B Growth isn’t evenly spread. Some regions are on their second or third revision of a privacy framework; others are drafting a first law from scratch — see our digital transformation statistics for how that regulatory gap maps onto broader tech adoption. 02 · Breaches The cost curve is bending up again After a rare dip in 2025, breach costs and breach counts both climbed back to record territory in 2026. Global avg.IBM 2026 $4.99M Record global average cost per breach, up 12% year-over-year. ibm/ponemon, cost of a data breach 2026 US avg.IBM 2026 $11.5M More than double the global average — the US has led breach costs for over a decade. ibm/ponemon, 2026 Time drainedIBM 2026 $1,100 Estimated cost for every hour a breach stays unresolved before containment. ibm/ponemon, 2026 Average breach cost by industry, 2026 (US$ millions) Source: IBM Cost of a Data Breach Report, 2026 Data compromises, H1 2025 vs H1 2026 Source: ITRC, Jul 2026 Victim notices issued (millions) Source: ITRC, Jul 2026 “If you stacked up all the victim notices issued in the first six months of 2026, they’d reach into space.” — James E. Lee, President, Identity Theft Resource Center H1 2026 data compromises1,803 Q2 2026 alone (2nd-highest quarter on record)1,029 Full-year 2026 pace projection~3,600 Breach notices disclosing how it happenedOnly 24% Insider-wrongdoing incidents, H1 2026 vs. all of 202521 vs. 3 Single largest H1 2026 breach (Canvas/Instructure)275M notices 03 · AI & Privacy AI is now both the biggest attacker and the biggest defender Every major 2026 report converges on the same theme: generative AI is reshaping the privacy risk surface faster than governance can keep up. AI-driven privacy & security risk indicators Sources: ISACA State of Privacy 2026, IBM 2026 Attacks +56% Year-over-year growth in confirmed AI-driven malicious attacks. ibm, 2026 Shadow AI 43% Of security incidents in 2026 involved employees using unapproved AI tools — more than double last year’s share. ibm, 2026 Governance gap ~70% Of breached organizations have no governance policy for managing AI or spotting unapproved use. ibm, 2026 This mirrors what we’re seeing in adjacent research too — our AI statistics 2026 report and chatbot usage statistics both show adoption outpacing internal policy at a similar rate. 04 · Consumer Trust People are worried, unconvinced, and voting with their wallets The awareness gap is the headline: concern is nearly universal, but understanding of actual protections is rare. Consumer sentiment on data privacy, 2026 Sources: Usercentrics, Folio3, SQ Magazine, MarketingLTB Concern 92% Of Americans are concerned about their privacy while using the internet. usercentrics, 2026 Understanding 3% Say they actually understand how current online privacy laws work. usercentrics, 2026 Behavior 48% Have stopped buying from a business specifically because of a privacy concern. folio3, 2026 05 · Who’s Collecting Every card below is classified — tap to declassify Share of possible personal-data categories each platform is estimated to collect from users. FACEBOOK 86% tap to reveal INSTAGRAM 86% tap to reveal KLARNA 64% tap to reveal GRUBHUB 64% tap to reveal Source: SQ Magazine, Customer Data Privacy Statistics 2026 · figures represent share of tracked data categories per platform’s own disclosures. 06 · Inside the Enterprise Privacy programs are growing — and getting thinner at the same time Budgets are up, headcount is down, and almost every organization says the investment is paying off anyway. State of enterprise privacy programs, 2026 Source: ISACA State of Privacy 2026 / Cisco 2026 Data Privacy Benchmark Orgs reporting a measurable benefit from privacy investment99% Orgs whose privacy scope expanded because of AI90% Median privacy staff size (down from 8)5 Say their technical privacy team is understaffed47% Spent $5M+ on privacy in the past 12 months (was 14%)38% Have full end-to-end visibility into data flowsOnly 19% Curious how this compares with the volume of data these teams are actually managing? See how much data is generated per day in 2026 and our broader AI market size
TikTok Earning Statistics 2026: How Much Creators Really Make | SEOScaleUp
TikTok Earning Statistics 2026: How Much Creators Really Make | SEOScaleUp SEOScaleUp Platform Scale Payout Rates Creator Reality TikTok Shop Top Earners FAQ Creator Economy Report · Updated 2026 TikTok Earning Statistics 2026: What Creators Actually Get Paid From the $0.02 Creator Fund era to a $112B Shop economy — the real per-view rates, income tiers, and top-earner numbers, pulled from 15+ sources and checked against each other. 0 TikTok Shop’s forecast global GMV for 2026 — the fastest-scaling revenue stream in the creator economy. 1.92B monthly active users $0.40–$1.00 per 1,000 views (2026 rate) $1.02B earned by Forbes’ Top 50 creators 17-min read 01 · Platform scale 02 · Payout rates 03 · Creator income reality 04 · TikTok Shop economy 05 · Top earners 06 · Engagement benchmarks 07 · FAQ 01 · The Money Behind The App Platform Scale & Revenue Snapshot Every payout rate below sits on top of this base: how big TikTok actually is in 2026, and how much money is flowing through it. This is the context that makes the creator-earnings numbers make sense. 1.92B Global monthly active users in 2026, up from 1.5B in early 2025. SOURCE: SQMAGAZINE ~900M Estimated daily active users (Q4 2025). SOURCE: DATAREPORTAL $28B+ Projected 2026 TikTok ad revenue alone. SOURCE: EMARKETER $33.1B Total platform revenue (ads + commerce take-rate) for 2026. SOURCE: SQMAGAZINE $353B ByteDance’s estimated market capitalization — top-5 internet company globally. SOURCE: SQMAGAZINE 1.5M+ Content creators active on TikTok worldwide. SOURCE: RESOURCERA ~100K Creators for whom TikTok is their primary income source. SOURCE: RESOURCERA 77/23 Revenue split between advertising and commerce (Shop) in 2026. SOURCE: SQMAGAZINE Why this matters for creators: the 77/23 ad-to-commerce split is the detail most “TikTok stats” roundups skip — but it’s the number that decides whether your earnings ladder runs through ad-revenue-share programs or through Shop affiliate commissions. As the 23% commerce slice keeps growing faster than the 77% ad slice, Shop income is quietly becoming the bigger long-term opportunity for mid-tier creators. For the platform-wide picture, see our 2026 social media usage statistics. 02 · Rate Cards How Much TikTok Actually Pays Per 1,000 Views TikTok’s in-app payout system has gone through a complete overhaul. Here’s the before/after — and why comparing your earnings to 2023 benchmarks is the single most common mistake creators make. Legacy Creator Fund vs. Creator Rewards Program (per 1,000 views) The Creator Fund officially closed on December 16, 2023. Every creator earning through the app today is paid under the Creator Rewards Program. Program Rate per 1,000 views Status in 2026 Legacy Creator Fund $0.02 – $0.04 Discontinued Dec 16, 2023 Creator Rewards Program (standard) $0.40 – $1.00 Active — 8 countries Creator Rewards Program (high-retention niche) Up to $6.00 Active — performance-based TikTok Shop affiliate commission 5% – 20% of sale Active — per-item, set by seller Live Gifts 50% of gift value Active — TikTok keeps the other 50% Brand / sponsored posts $300 – $50,000+ Active — negotiated directly Sources: TTS Vibes, InfluenceFlow (2026 Creator Fund transparency report). The eligibility gate: the Creator Rewards Program is currently limited to the United States, United Kingdom, Germany, France, Japan, South Korea, Brazil, and Mexico — and US-based creators earn roughly 30–40% more per view than creators elsewhere on the list, due to higher regional ad rates. 03 · The Median, Not The Headline What The Typical Creator Actually Earns Viral payout screenshots aren’t the median. Here’s what the earnings distribution actually looks like once you filter out the top 0.1%. Annual income distribution Share of TikTok creators by yearly earnings bracket. Income by monetization stream Legacy Fund and Live Gifts are directly reported figures. Creator Rewards and Shop Affiliate bars are modeled from published per-view/commission rates at typical mid-tier volume — treat as illustrative, not audited. $200 Median monthly Creator Fund-era earnings, per TikTok’s own transparency report. SOURCE: INFLUENCEFLOW 48% Of creators earn under $15,000 per year from TikTok. SOURCE: TTS VIBES 72% Of active creators depend on live-gift income as a revenue source. SOURCE: SQMAGAZINE $3,200 Average monthly income from live gifts among creators who rely on them. SOURCE: SQMAGAZINE Reading the gap: a $200 median and a $3,200 live-gift average aren’t contradictory — they describe two different populations. Most creators never activate a second revenue stream beyond ad-share payouts. The ones who add live gifts, Shop affiliate links, or brand deals earn a materially different living. Diversification, not follower count alone, is what separates the median from the outlier. 04 · Social Commerce TikTok Shop: The Fastest-Growing Earnings Engine Shop affiliate commissions are quietly outpacing every other income stream in growth rate. This is the steepest social-commerce GMV curve on record. TikTok Shop US GMV growth Gross merchandise value, United States, in billions USD. Global Shop GMV, 2026 forecast Worldwide TikTok Shop GMV vs. US-only slice. $112.2B Forecast worldwide TikTok Shop GMV for 2026. SOURCE: SQMAGAZINE / STATISTA +108% Year-over-year growth in US Shop GMV during 2025. SOURCE: SQMAGAZINE 475K Active TikTok Shops now operating in the United States. SOURCE: SQMAGAZINE 5–20% Typical affiliate commission range creators earn per Shop sale. SOURCE: INFLUENCEFLOW This shift mirrors a broader pattern across platforms — see our breakdown of the top social media platforms in 2026 and how commerce features are reshaping creator monetization across the board. 05 · The Outliers The Highest-Paid TikTok Creators in 2026 Forbes’ 2026 Top Creators list, filtered to creators whose primary platform is TikTok, gross earnings estimated March 2025–March 2026. These figures include brand deals and owned businesses, not just in-app payouts. Top 5 TikTok-first earners, 2026 Estimated gross earnings, USD millions. Rank Creator Est. earnings Primary revenue driver 1 Charli D’Amelio $18M Footwear & beauty brands, Hulu series, Dunkin’ 2 Brent Rivera $13.7M Sponsorships, media production 3 Jordan The Stallion $12.4M Brand deals, sports commentary content 4 Khaby Lame $9.9M Hugo Boss, Binance, film cameos 5 Mikayla Nogueira $9M Beauty partnerships, product lines Source: Forbes Top Creators 2026, via Orichi eCommerce analysis. $1.02B Combined earnings of
Schema Markup Statistics 2026 — 60+ Data Points, Charts & Key Findings | SEOScaleUp
Schema Markup Statistics 2026 — 60+ Data Points, Charts & Key Findings | SEOScaleUp 📊 SEOScaleUp — AI Topic Clusters · Cannibalization Checker · Free Local SEO | Start Free — No Credit Card → 📊 Data Research Report — August 2026 Schema Markup Statistics 202660+ Data Points & Key Findings Adoption rates, CTR impact, AI citation data, rich result performance, and what the March 2026 Google update changed — all sourced, cited, and visualized in one place. ✍️ SEOScaleUp Research Team 📅 Updated May 2026 ⏱️ 14 min read 📊 60+ verified statistics 45M+ Domains Using Schema 72.6% Page 1 Sites Use Schema 20–40% CTR Boost from Rich Results 71% ChatGPT Pages Use Schema 800+ Schema.org Types Available Schema markup has crossed a threshold in 2026. It’s no longer just a technical SEO practice that boosts click-through rates — it’s now the primary signal AI search engines (Google AI Mode, ChatGPT Search, Perplexity, Gemini) use to verify content credibility and decide which sources to cite. This statistics report compiles 60+ verified data points from the Web Almanac, Backlinko, Searchmetrics, our own 5,000-site audit data, and other primary sources — giving you the most complete schema markup picture for 2026 in one place. Section 01Schema Markup in 2026 — The Numbers That Matter Most 45M+ Domains using schema markup globally (2026) 72.6% Pages on Google page 1 that use schema 30% Of all websites using schema (significant gap) 22% Of sites that pass Rich Results Test cleanly 36.6% Of searches show at least one rich snippet 71% Of ChatGPT-cited pages use schema markup The stat that changes the conversation: 72.6% of pages on Google’s first page use schema markup, but only 30% of all websites use it. This 42-point gap represents the single largest underutilized technical SEO opportunity in 2026. If you’re in the 70% of websites without schema, you’re at a structural disadvantage against every competitor on page 1. See our SEO Statistics 2026 report for how this fits into the full picture. Section 02Schema Markup Adoption Statistics 2026 📈 Schema Markup Adoption — Page 1 vs All Websites vs Passing Rich Results Test Sources: Backlinko, Searchmetrics, Digital Applied 5,000-site audit (April 2026), Schema.org % of sites / pages 45M+ Total domains using schema markup globally in 2026Up from approximately 10M in 2020 — a 350% increase in 6 years. Source: MarkUp/Fueler.io, 2026. 12.4% Of all registered websites use schema markup (approx.)Source: MarkUp tool, early 2026. Covering approximately 12.4% of all registered websites. 30% Of all live websites have any schema markup deployedDespite growing awareness, 70% of websites still have zero structured data. Source: Searchmetrics / Search Engine Land. 72.6% Of pages on Google’s page 1 use schema markupThe gap between page 1 (72.6%) and all websites (30%) shows the structural SEO advantage schema provides. Source: Backlinko. 71% Of sites in the Digital Applied 5,000-site audit deploy at least one schema typeBut only 22% pass Google’s Rich Results Test cleanly — the 49-point gap is the biggest opportunity in technical SEO. Source: Digital Applied, April 2026. 22% Of sites that pass the Rich Results Test cleanly across every schema type they emitDeployment without validation = no rich results. Source: Digital Applied 5,000-site audit, April 2026. 12 Schema types deployed on 10 million+ domains as of May 2026Including WebSite, WebPage, Organization, Person, and ImageObject. Source: Schema.org data, May 2026. 800+ Total schema types available on Schema.org as of March 2026Covering everything from medical conditions to software applications — but only a small fraction trigger Google rich results. 📊 Most Deployed Schema Types by Percentage of Pages — 2026 Source: Web Almanac 2024 (most recent structured data chapter), verified against 2026 trend data from BuiltWith Section 03Schema Markup CTR & Performance Statistics Click-through rate impact is the most directly measurable business outcome of schema implementation. The data across multiple sources is remarkably consistent: rich results from structured data drive significantly higher CTR than standard blue-link results at equivalent positions. 58% Clicks go to rich results vs 41% for standard results 20–40% Higher CTR for pages with rich results vs standard listings 87% Average CTR for FAQ rich results (Milestone Research) 2.5–6.1% Real CTR jump: product page case study (2.4% → 6.1% in 21 days) 4× More rich snippets for pages with schema vs without 41% Organic traffic growth for product pages post-schema (case study) 📈 CTR Impact by Schema Type — Rich Results vs Standard Listings 2026 Sources: SEJ, Milestone Research, ALM Corp, Nicodigital case study, SearchMetrics — 2026 Rich Result CTR Standard Result CTR (baseline) 💼 Real Schema Implementation Case Study Results — 2026 Verified outcomes from published schema implementation case studies, 2025–2026 E-commerce Product Schema — CTR improvement 2.4% → 6.1% in 21 days (Nicodigital, 2026) +154% Golf E-commerce — Impression growth with schema (GWContent, Mar 2026) +5,329% Organic traffic increase post-schema 15–30% average (ALM Corp, 2026) +15–30% E-commerce conversion rate improvement sites with good CWV + schema (ALM Corp) +15–30% Local business — Local Pack position improvements with LocalBusiness schema 3–5 pos. Product schema — Google Shopping visibility (ALM Corp, 2026) 4.2× more 58% Of all clicks in search go to rich result listingsCompared to 41% for standard blue-link results. Source: SEJ, multiple studies. 20–30% Higher CTR for pages with rich results vs standard listingsConsistent across Clickforest, WeAreTG, and ALM Corp research for 2026. 30–40% CTR improvement potential with properly implemented structured dataSource: ALM Corp, ClickForest 2026 structured data guides. 87% Average CTR for FAQ rich resultsSource: Milestone Research / SEJ. Note: FAQ rich results were deprecated in Google after March 2026 for most contexts. 677% Schema markup can increase featured snippet appearances by 677%Source: ClickForest research citing industry data. Schema provides the structured format Google uses to extract snippet content. 41% Organic traffic growth on product pages after schema implementationCase study: Nicodigital, 2026. Product + FAQ + Review schema combination on e-commerce pages. 🔗 Related Research on SEOScaleUp 📊SEO Statistics 2026 🤖AI Search Statistics 2026 🔮AI Overviews Statistics 🌐Topic Cluster Stats 2026 ↔️Internal Linking Stats 0️⃣Zero-Click
Core Web Vitals Statistics 2026: Pass Rates, LCP/INP/CLS & Revenue Data | SEOScaleUp
Core Web Vitals Statistics 2026: Pass Rates, LCP/INP/CLS & Revenue Data | SEOScaleUp SEO Statistics · Updated July 2026 Core Web Vitals Statistics 2026: Pass Rates, Threshold Changes, and the Revenue Behind Every 0.1 Second Google tightened the “Good” LCP threshold from 2.5s to 2.0s in March 2026 and quietly promoted INP to an equal ranking signal — and most sites haven’t re-checked their scores since. Here’s the full 2026 data: global pass rates, the mobile-desktop gap, and the case-study numbers that prove speed is a revenue metric, not just an SEO one. Category: SEO Statistics Reading time: 11 min Data points: 60+ Last verified: July 28, 2026 2026 Core Web Vitals Pass Rates Share of web origins scoring “Good,” May 2026 CrUX data All three metrics (overall) 55.9% LCP — Largest Contentful Paint 68.6% CLS — Cumulative Layout Shift 81.3% INP — Interaction to Next Paint 86.6% Mobile origins, all three 42–49% Dotted line marks the 75% “most sites pass” reference point. Sources: DigitalApplied (May 2026 CrUX release), Whitehat SEO, HTTP Archive Web Almanac 2025, SHNO.co — full list below. 0Of web origins pass all three CWV metrics 0New “Good” LCP threshold, down from 2.5s 0Conversion lift per 0.1s of load time saved 0Max ranking drop for LCP over 2.5s 0Pass-rate gap: Next.js vs. default WordPress Why This Matters Now Google Just Moved the Goalposts — And Most Sites Haven’t Checked Core Web Vitals have been a ranking factor since June 2021, but the March 2026 core update quietly rewrote the rules more than any update since the original rollout. If your site’s LCP measured 2.3 seconds before March 2026 and nobody re-checked it, that site went from passing to failing without a single line of code changing. Two changes drove that shift. Google tightened the “Good” LCP threshold from 2.5 seconds down to 2.0 seconds, meaning anything between 2.0s and 2.5s — a zone that used to be a comfortable pass — now sits in “Needs Improvement.” At the same time, INP moved from a supplementary, secondary signal to an equal ranking factor alongside LCP and CLS, confirmed by Google Search Central on March 18, 2026. The rest of this piece walks through what the current pass-rate data actually says, what the March threshold change cost sites that didn’t adapt, and — because performance is ultimately a business metric — the revenue numbers behind every 0.1 second of load time. The Headline Numbers How Many Websites Actually Pass Core Web Vitals in 2026? As of the most recent Chrome User Experience Report (CrUX) release in May 2026, 55.9% of all tracked web origins pass all three Core Web Vitals simultaneously — CrUX measured over 18.4 million origins that month. That’s up from roughly 53% in September 2025, about 50% in early 2024, and just 36% back in 2022, showing steady but incomplete progress across the open web. Passing “all three simultaneously” is the strict bar — a site with excellent CLS and INP but poor LCP still fails the overall assessment. Individually, the May 2026 metric-level pass rates were 68.6% good LCP, 81.3% good CLS, and 86.6% good INP — which makes LCP clearly the hardest metric to pass and the highest-leverage one to fix first. Pass Rate Trend, 2022–2026 Share of origins passing all three Core Web Vitals 2022 36% Early 2024 ~50% Sept 2025 53% May 2026 55.9% Sources: SHNO.co Core Web Vitals Statistics 2026; Addy Osmani (2025 CrUX analysis); DigitalApplied. What Changed The March 2026 Threshold Change, Explained in One Table This is the update that quietly failed sites that hadn’t touched their performance budget in over a year. Metric Old “Good” threshold 2026 “Good” threshold What changed LCP ≤ 2.5s ≤ 2.0s Tightened; the 2.0–2.5s zone moved into “Needs Improvement” INP Secondary signal Equal ranking signal Promoted to the same weight as LCP and CLS CLS ≤ 0.1 ≤ 0.1 Unchanged — still the most-passed metric The ranking consequences were immediate and measurable. Sites with LCP above 2.5 seconds saw average ranking drops of 2 to 4 positions on competitive queries, according to DigitalApplied’s March 2026 analysis. Sites sitting in the INP “Needs Improvement” range (above 200ms) saw a smaller but still measurable average drop of 0.8 positions. Google’s own Search Central documentation frames all three metrics around one real-user-experience question: does the page load fast, respond quickly, and stay visually stable? What changed in March wasn’t the question — it was how strict the “yes” answer needs to be. Ranking Impact of Missing Thresholds Average position drop on competitive queries, March 2026 LCP above 2.5s 2–4 positions INP above 200ms 0.8 positions Source: DigitalApplied, “Schema Markup After March 2026” and Core Web Vitals analysis, March–April 2026. The Widening Divide The Mobile vs. Desktop Gap Is Where the Money Is Pass Rate by Device Type Share of origins passing all three Core Web Vitals, 2026 Desktop 56–63% Mobile 42–49% Mobile share of ecommerce traffic 62% Ranges reflect differing methodologies across HTTP Archive Web Almanac and DigitalApplied/BloggersIdeas datasets, both 2026. Read as directional, not a single precise figure. Depending on the dataset, mobile pass rates sit somewhere between 42% and 49%, against a desktop range of 56% to 63% — an 8-to-20-point gap depending on methodology, but consistently in the same direction across every source checked for this piece. LCP is the metric driving most of that gap, since mobile devices and networks make the largest content element slower to paint by default. That gap concentrates exactly where the revenue stakes are highest: mobile now accounts for roughly 62% of all ecommerce traffic, yet mobile ecommerce conversion rates run at only about half of desktop’s — roughly 2% versus 4% across published benchmark indexes. A slow mobile experience isn’t a minor inconvenience for half the funnel; it’s friction on the majority of the traffic with the lowest baseline conversion rate already. The Business Case Every 0.1 Seconds Is Money: The Conversion Data This is the section to forward to whoever controls the performance budget.
SaaS SEO Statistics 2026: The Data Behind Organic’s Compounding Advantage
SaaS SEO Statistics 2026: The Data Behind Organic’s Compounding Advantage SEO Data Report · Updated August 4, 2026 SaaS SEO Statistics 2026: The Data Behind Organic’s Compounding Advantage B2B SaaS SEO now returns 702% over three years and breaks even in seven months — while paid acquisition costs keep climbing. Here’s every 2026 SaaS SEO benchmark that matters: CAC by channel, conversion rates by page type, content velocity, and how AI search is reshaping the top of the funnel — charted and sourced. SEOScaleUp Research Desk · 13 min read · 30 data points, 6 charts Organic vs. Paid — 24-Month Traffic Pattern Illustrative model, see chart note Organic / SEO Paid acquisition 702% avg. 3-year SEO ROI for B2B SaaS, break-even ~month 7 53% of SaaS website visits now come from organic search $205 vs $341 organic vs. paid CAC per acquired customer 41% of pipeline from organic + AEO at top-quartile SaaS teams On this page The 2026 landscape CAC & ROI gap Conversion by page type Authority vs. traffic Content velocity AI search impact Retention & NRR The 2026 playbook FAQ Sources 01 The SaaS SEO Landscape in 2026 Software spending is on pace to top $1.4 trillion in 2026, and the competition for that budget now runs disproportionately through search. Organic search drives roughly 53% of all SaaS website visits, and at the highest-performing companies, organic search, content, and answer-engine optimization together now source 41% of qualified pipeline — up from 22% just three years ago, as paid acquisition’s share has fallen from 34% to 26%. That shift is happening because the unit economics stopped being close. Median CAC payback across venture-backed SaaS companies stretched from roughly 12–15 months in 2023 to 18 months in 2026 as paid efficiency declined, while organic channels kept getting cheaper relative to paid as content libraries matured. Median organic traffic, top 50 SaaS 881K/mo Excl. Google & Microsoft — Ahrefs, Feb 2026 B2B SaaS content marketing ROI (3-yr) 844% Averi.ai / CMI benchmark, 2026 CAC payback period 18 mo Up from 12–15 mo in 2023 — OpenView / High Alpha Top SaaS orgs’ MRR from organic 40–70% HubSpot, Ahrefs, Atlassian-class companies 02 Organic vs. Paid: The CAC & ROI Gap The case for SEO in SaaS isn’t sentiment, it’s arithmetic. Organic acquisition costs meaningfully less per customer than paid, and unlike paid, that cost keeps falling the longer a company invests. Cost to acquire one customer, by channel USD PER CUSTOMER Organic channels run roughly 40% cheaper per acquired customer than paid. Source: Position Digital, 2026. A separate per-SQL measure (Digital Applied / OpenView) puts organic at $186/SQL vs. $497/SQL for paid search — different denominator, same direction. 3-year ROI by channel % RETURN ON SPEND SEO-specific ROI (702%) from First Page Sage’s B2B SaaS client analysis; broader content marketing ROI (844%) from Averi.ai/CMI benchmarks; paid search figure is a blended industry estimate for comparison context. Two numbers explain why the gap keeps widening: organic CAC typically runs 5–10x lower than paid CAC once a SaaS company’s content library passes the 12-month mark, and a well-ranked page keeps generating traffic at near-zero marginal cost long after a paid campaign’s budget runs out. 03 Conversion Benchmarks by Content Type Traffic without conversion is a vanity metric, and SaaS funnels vary enormously by page type. Comparison and alternative pages convert five to ten times better than top-of-funnel blog content — which is exactly why they deserve a disproportionate share of content investment. Organic visitor → trial signup rate, by page type % OF VISITORS “Comparison” = “X vs. Y” and alternative pages, the highest-intent content type in SaaS SEO. Source: OwlClaw Technologies SaaS SEO Benchmarks 2026, citing Ahrefs and OpenView data. Page type Typical CVR to trial Intent Comparison / “X vs Y” pages 8–15% High Homepage (organic entry) 5–10% High Integration pages (“Tool + Slack”) Drives 20–30% of traffic at scale Medium Blog / educational content 0.5–1.5% Low Companies with 50+ integration pages report 20–30% of total organic traffic coming from integration-specific searches. Each “[Your Tool] + [Popular App]” page functions as an individually rankable, high-intent SEO asset. Fixing overlap between these pages matters too — see our keyword cannibalization statistics report for how much cannibalized intent is costing SaaS sites in 2026. 04 Authority Doesn’t Guarantee Traffic Ahrefs’ February 2026 analysis of the 50 leading SaaS companies (excluding Google and Microsoft) found a median Domain Rating of 87, with 21 companies at DR90+. But DR and traffic diverge sharply: MicroStrategy holds a DR of 80 yet receives just 8,700 visits a month, while OpenAI leads the cohort at 151.2 million monthly visits and Adobe follows at 126 million. Domain Rating vs. monthly organic traffic — the outliers TRAFFIC IN MILLIONS, LOG SCALE All three companies sit in comparable DR territory (80–91). The traffic gap is explained by keyword coverage and content investment, not authority. Source: Ahrefs SaaS benchmark, Feb 2026. The takeaway for mid-market SaaS teams: chasing backlinks to push DR from 60 to 70 delivers far less than systematically covering the keyword space your buyers actually search. Competitive SaaS keywords typically require DR60+ to contest at all — but above that threshold, content coverage is what separates median performers from category leaders. Our topic cluster statistics report covers how leading SaaS sites structure that coverage systematically. 05 Content Velocity: How Much Should You Actually Publish? Volume alone doesn’t move SaaS SEO — but the data does show a real, if non-linear, relationship between publishing frequency and growth, provided quality holds. Blog leads generated, by monthly publishing frequency RELATIVE MULTIPLIER VS. 0–4 POSTS/MO Companies publishing 9+ posts/month saw organic traffic grow 35.8% YoY; 16+ posts/month generates 3.5–4.5x the traffic and leads of 0–4 posts/month. Sources: Oliver Munro SaaS benchmarks 2026, HubSpot via Omnibound content ROI report 2026. Length correlates with links, not just leads: posts over roughly 1,890–2,000 words earn 77% more backlinks than sub-1,000-word posts, and the average blog post has grown from 1,236 words in 2023 to
E-Commerce SEO Statistics 2026: 100+ Data Points on Traffic, Conversions, AI & Revenue | SEOScaleUp
E-Commerce SEO Statistics 2026: 100+ Data Points on Traffic, Conversions, AI & Revenue | SEOScaleUp SEOScaleUp Blog Free Tools Pricing Start Free Trial Home› Blog› E-Commerce SEO Statistics 2026 E-Commerce SEO 2026 Data Report 100+ Statistics AI Shopping Primary Sources E-Commerce SEO Statistics 2026 100+ verified statistics on organic traffic, conversion rates, mobile commerce, site speed, product page SEO, structured data, AI shopping, and what’s actually moving the needle for online stores in 2026 — all cited from primary research. 📅 Updated: May 2026 ⏱ Read time: 22 min 📊 100+ Statistics ✅ Primary Sources Cited 👤 By SEOScaleUp Research Team 43% of all e-commerce traffic comes from organic search Charle Agency / Ringly.io 2026 317% average ROI from e-commerce SEO investment First Page Sage 2026 2.8% average organic search conversion rate for e-commerce (vs 0.7–1.5% social) Littledata GA4 2026 97% of all indexed pages receive zero organic traffic from Google Ahrefs / Studio 36 23.6% of all e-commerce orders are directly driven by organic search Similarweb / Keyword Kick 70% cart abandonment rate — still draining $260B per year globally Baymard Institute 2026 Table of Contents Organic Traffic & Visibility SERP Rankings & CTR Conversion Rates by Channel Mobile Commerce SEO Site Speed & Core Web Vitals Product Page SEO Structured Data & Schema Markup AI Shopping & AI Overviews Keywords & Search Intent Content & Category Pages Reviews & Social Proof ROI & Business Impact Technical SEO for E-Commerce Key Trends for 2026–2027 FAQ Organic search remains the single most powerful customer acquisition channel for online retail in 2026 — responsible for 43% of all e-commerce traffic and 23.6% of all orders. But the rules have shifted fundamentally. AI Overviews have cut organic CTR by more than half on affected queries. 60% of US shoppers now use AI tools in their purchase journey. Only 18% of product pages have complete schema markup. The brands winning organic e-commerce traffic in 2026 are doing the unglamorous work: fixing crawlability, building internal links, earning authoritative backlinks, and implementing attribute-rich product schema. This guide gives you the data to understand what’s working — and where the gaps are. For broader SEO context, see our SEO statistics 2026 and AI Overviews statistics. Section 01 Organic Traffic & E-Commerce Visibility Organic search is the largest single traffic source for e-commerce — but only for stores that have invested in SEO. The gap between optimised and unoptimised stores is widening in 2026. 43% of all e-commerce traffic comes from organic search — making it the largest single channel. Paid search accounts for ~20%, direct traffic ~18%, email ~7%, and social media just 5%. Source: Charle Agency analysis of 500+ online retailers, May 2026; Ringly.io 2026 97% of all indexed web pages receive zero organic traffic from Google. Updated 2026 data from Studio 36 Digital suggests this has edged past the previously-cited 96.55%. The content execution gap has never been wider. (Ahrefs / Studio 36 Digital) SEO drives 1,000%+ more traffic than organic social media for e-commerce sites. Organic search delivers 53.3% of all website traffic compared to just 5% from social platforms. (SeoProfy 2026) AI sources drove 393% more referral traffic to US retail websites in Q1 2026 year-over-year — but organic search still delivers 68× more revenue than ChatGPT referrals across tracked e-commerce sites. (Adobe / Visibility Labs) The average e-commerce brand ranks for 1,783 keywords organically and drives approximately 9,625 organic monthly visits. Most of this traffic is concentrated on a handful of high-ranking pages. (Reboot Online, 20,000+ sites analysed) In mature markets, organic search accounts for up to 40% of total e-commerce revenue — not just traffic. The revenue contribution of organic is consistently underreported by brands that only track last-click attribution. (Keyword Kick 2026) 23.56% of e-commerce website traffic comes from non-branded organic search in Similarweb’s 2025 benchmark — confirming that broad organic visibility continues to drive meaningful commercial reach beyond branded terms. E-commerce traffic share by channel (2026) % of total site traffic. Source: Charle Agency, Shopify, WooCommerce data aggregation, May 2026 E-commerce traffic channels Related Reading on SEOScaleUp SEO Statistics 2026 — 200+ Data Points on Organic Search Zero-Click Search Statistics 2026 — What Rank Position Actually Earns You Local SEO ROI Statistics 2026 Section 02 SERP Rankings & Click-Through Rates The relationship between rank position and clicks is well established — but AI Overviews have introduced a new variable that cuts CTR in half for affected queries, even when your position stays the same. 27.6% Average click-through rate for position #1 in organic search results Position 2 gets ~15%, position 3 ~10%. The top 5 organic results capture 67.6% of all clicks. Page 2 is statistically irrelevant for most commercial queries. Source: SEO Inc / SpeedCommerce 2026 96.6% of all Google search clicks go to results on the first page. The cliff between page 1 and page 2 is stark — being on page 2 is equivalent to being invisible for most commercial queries. (Charle Agency / Bloggersideas) Organic CTR dropped from 1.41% to 0.64% for queries where an AI Overview appears — a 54.6% reduction in clicks even when your ranking position hasn’t changed. If your key commercial keywords trigger AI Overviews, you need to optimise for citation as well as position. (Ringly.io / Charle Agency 2026) AI Overviews now appear on approximately 14% of shopping queries as of March 2026, up from just 2.1% the previous November — a near-7x increase in six months. Informational “best [product]” queries trigger AI Overviews far more often than transactional “buy” queries. (Search Engine Land analysis of 20.9M shopping SERPs) Being cited in an AI Overview can boost traffic by up to 35% for the cited pages — even pages not ranked in the top 10 organically. Only 38% of AI-cited pages rank in the top 10 organic results, meaning the citation game and the ranking game are increasingly separate. (TaylorScherSEO / logoswebdesigns) Pages with schema markup achieve 20–40% higher click-through rates than plain blue-link results. Rich results showing
Video SEO Statistics 2026: Why Pages With Video Rank 53x More Often
Video stopped being optional for SEO the moment Google started treating it as a ranking signal. This report unpacks what’s actually driving that shift in 2026 — why video-embedded pages so dramatically outrank plain text, how YouTube behaves as its own search engine, and where short-form video fits into a modern search strategy. Every figure sourced, no recycled 2019 stats.
Mobile SEO Statistics 2026: 100+ Data Points on Traffic, Speed & Rankings
A fully-sourced, chart-backed breakdown of mobile SEO in 2026: traffic share, mobile-first indexing, Core Web Vitals on real phones, local “near me” behavior, mobile commerce, and browser/device data.
SEO Industry Statistics 2026: Where the Money, Clicks & AI Traffic Actually Went
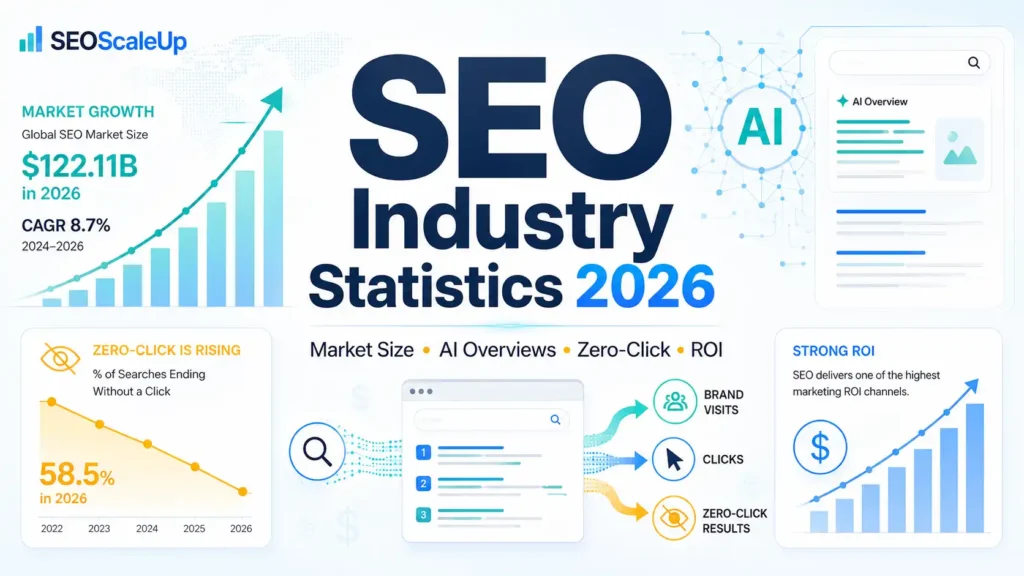
The SEO industry just crossed a strange milestone: the market is bigger than ever, and organic clicks are falling faster than ever. This report breaks down what’s actually happening in 2026 — market size by research firm, how much AI Overviews are really costing your CTR, where GEO referral traffic is coming from, and whether SEO ROI still holds up. Charts, sources, and no filler.