See Your Keyword Universe Come Alive With Interactive Visual Maps
Visualize keyword clusters instantly with SEOScaleUp's free Keyword Cluster Visualizer. See topic relationships, semantic groupings, and content pillars in an interactive visual map—no signup required.
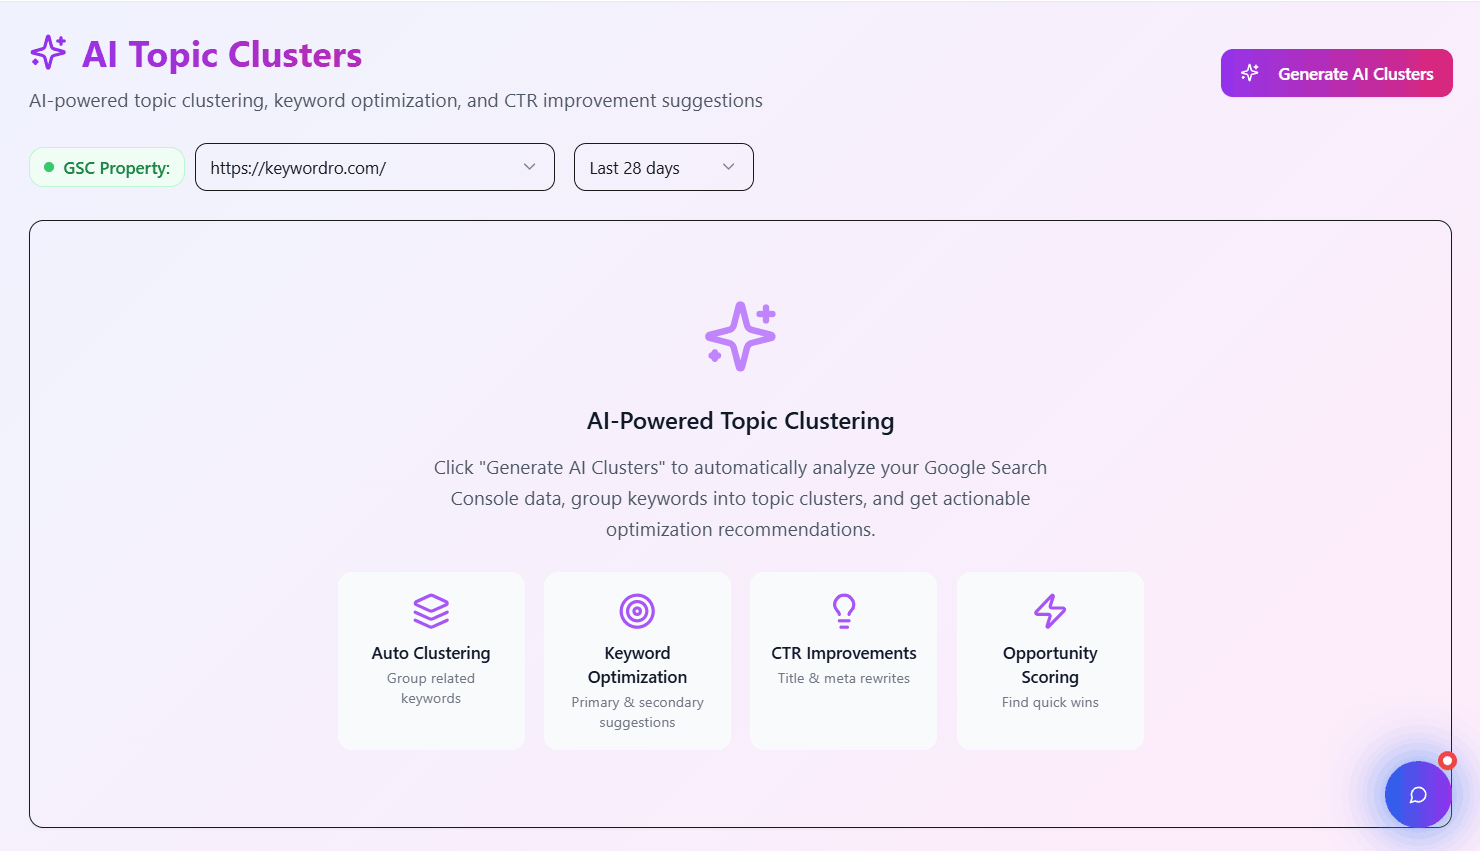
Stop Staring at Spreadsheets – See Your SEO Strategy Unfold Visually
Keyword visualization transforms raw keyword lists into interactive, color-coded cluster maps. Each bubble represents a topic cluster—size shows search volume, color indicates intent, and connections reveal semantic relationships between groups.
SEO professionals and content strategists waste hours trying to understand relationships between keywords from CSV files. Our Keyword Cluster Visualizer creates instant visual maps that reveal content gaps, topic hierarchies, and strategic opportunities at a glance.
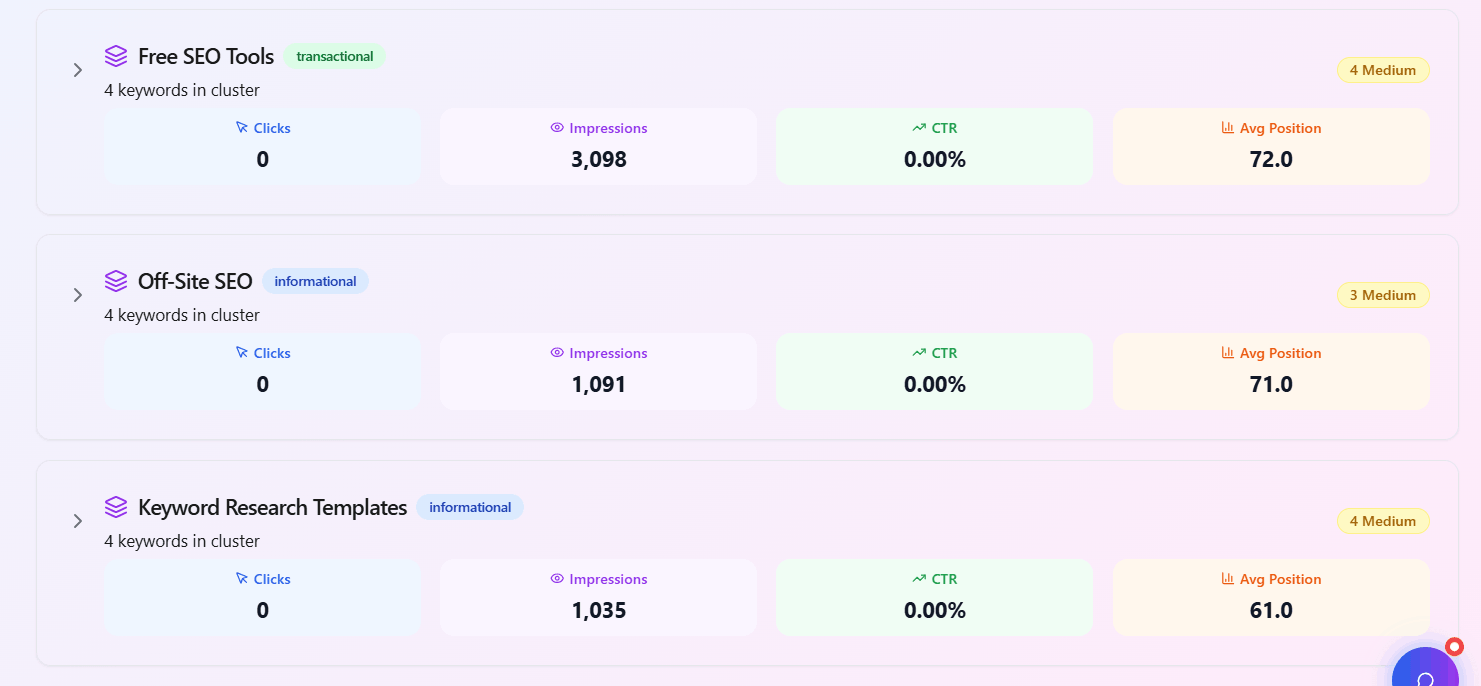
Interactive Bubble Map
Dynamic visualization where each bubble = a keyword cluster. Bubble size = total search volume, color = search intent. Hover to see all keywords in cluster.
Force-Directed Graph
See keyword relationships visualized as networks. Lines connect semantically related terms, revealing how topics interconnect across your content strategy.
Intent Heat Mapping
Color gradients instantly distinguish informational (blue), commercial (green), transactional (orange), and navigational (purple) clusters.
Volume & Difficulty Sizing
Bubble diameter scales with total cluster search volume. Border thickness shows average keyword difficulty—prioritize high-volume, low-difficulty clusters.
Zoom & Export Features
Zoom into specific clusters, pan across your keyword universe. Export visual maps as PNG or SVG for presentations and client reports.
Competitor Overlay
Overlay competitor keyword clusters onto your map. See where they have presence and where you have uncontested opportunities.
Turn Spreadsheet Chaos Into Visual Clarity in Minutes
Four steps to visualize your entire keyword strategy.
Input Keywords
Paste your keyword list or upload a CSV file.
AI Clustering Engine
Our algorithm groups keywords by semantics, SERP overlap, and intent.
Generate Visual Map
Interactive bubble map appears—color-coded, sized, and connected.
Explore & Export
Zoom, click clusters, export visuals for content planning.
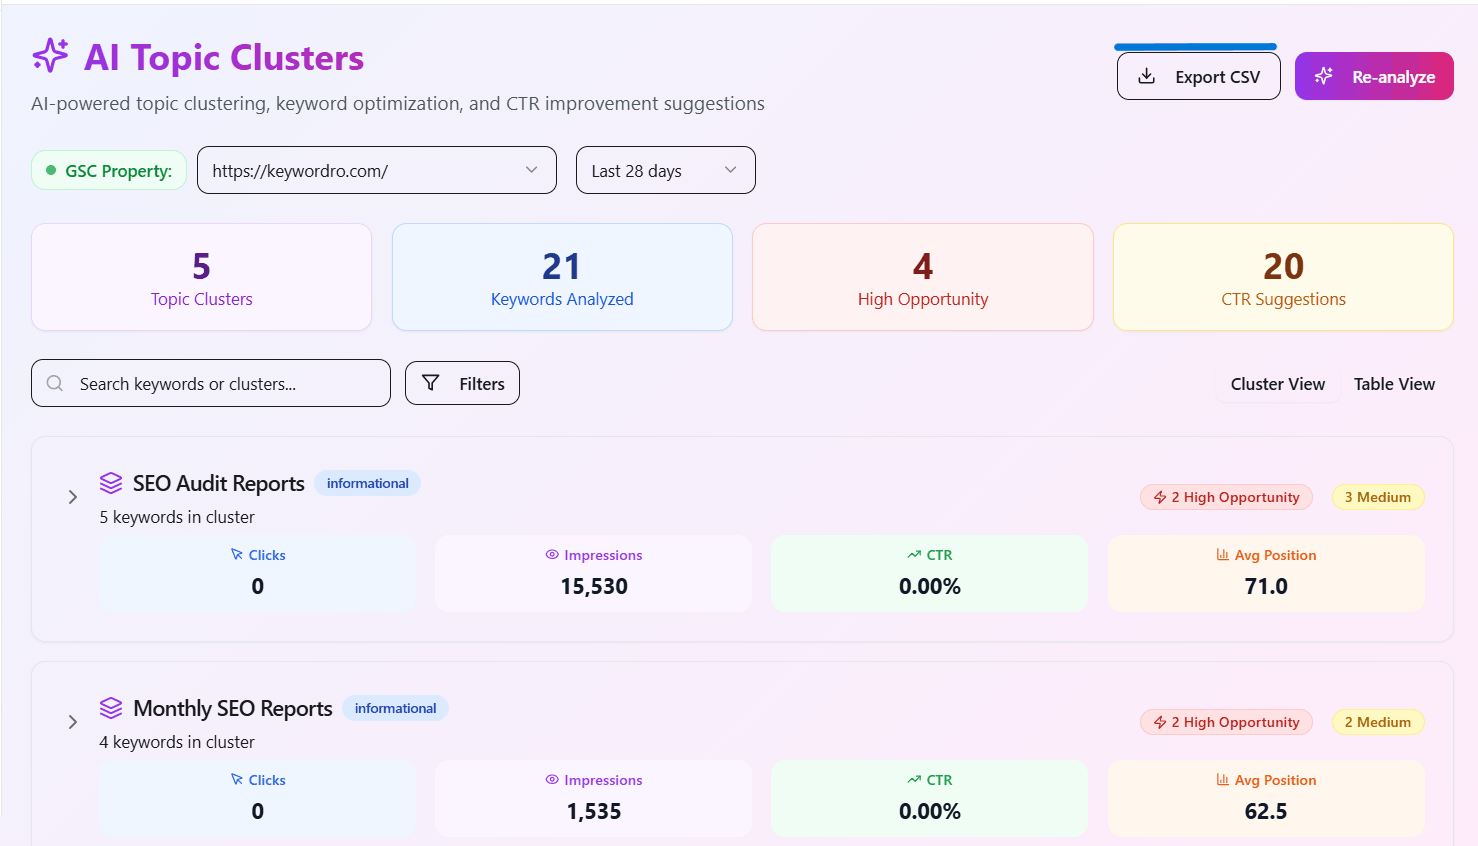
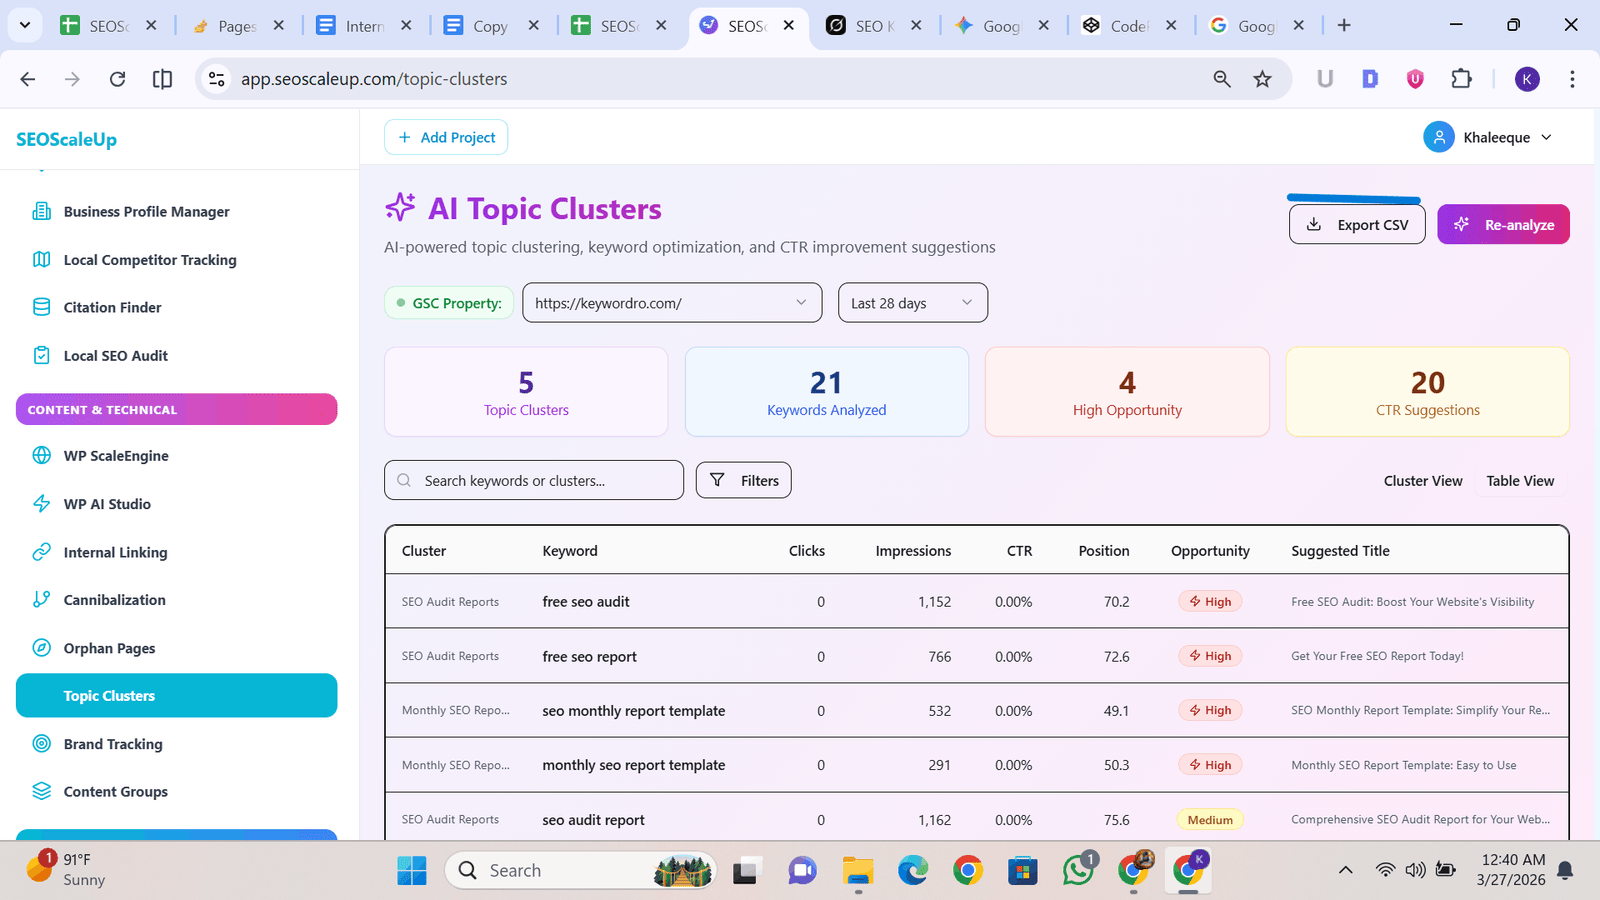
See Your SEO Strategy at a Glance & Make Better Decisions
Humans process visuals 60,000x faster than text—stop drowning in spreadsheets.
Empty areas on your visual map = topics you're not covering. See exactly where competitors have clusters you're missing.
Largest bubbles represent highest-volume clusters—perfect candidates for comprehensive pillar pages that dominate SERPs.
Visual connections reveal how keywords relate. Cluster A connected to Cluster B? Create internal links between pillar pages.
Show clients or executives a visual map instead of a 10,000-row spreadsheet. Everyone understands bubbles and colors instantly.
Larger bubbles = higher opportunity. Visual hierarchy makes prioritization intuitive—focus on big bubbles first.
Trusted by SEO Strategists & Content Directors Worldwide
Real professionals using visual maps to win.
SEO Strategists
- Present SEO strategies to executives visually
- Identify cannibalization risks between clusters
- Build topical authority maps for large sites
- Plan internal linking between related clusters
- Track cluster growth over time
Digital Marketing Agencies
- Wow clients with visual strategy presentations
- Compare client vs competitor cluster maps
- Deliver intuitive content briefs for writers
- Scale strategy across 100+ client accounts
- Prove thought leadership with visual reporting
Content Directors & Writers
- See how articles fit into larger topic ecosystem
- Identify supporting content for pillar pages
- Discover related topics to link between posts
- Plan quarterly content calendars visually
- Avoid writing duplicate content on same topics
eCommerce & Business Owners
- Map product categories to keyword clusters
- Identify informational content for top-of-funnel
- See which product groups have highest search volume
- Plan blog content around commercial clusters
- Visualize entire content ecosystem at once
Built by Data Visualization Experts for Clarity
Beautiful, intuitive, and actionable visual maps.
Beautiful Visualization Engine
Our D3.js-powered maps render thousands of keywords as interactive, responsive visualizations that work on any device.
Semantic Intelligence
Beyond simple keyword matching—our AI understands synonyms, intent, and SERP overlap for accurate cluster formation.
Zero Signup Friction
No registration, no credit card. Upload keywords, see visual map instantly—for free, forever.
SEOScaleUp vs Keyword Visualization Tools
| Feature | SEOScaleUp ✓ | Manual/Free Alternative | Expensive Paid Tool ($99+) |
|---|---|---|---|
| Interactive Bubble Map | ✓ | ✗ | ✓ |
| Force-Directed Graph View | ✓ | ✗ | ✓ |
| Intent Color-Coding | ✓ | ✗ | ✓ |
| Bubble Sizing by Volume | ✓ | ✗ | ✓ |
| Difficulty Border Overlay | ✓ | ✗ | ~ limited |
| Competitor Overlay | ✓ | ✗ | ✓ |
| PNG/SVG Export | ✓ | ✗ | ✓ |
| 10,000 Keywords per Map | ✓ | ✗ | ✓ |
| Free Forever Plan | ✓ | ✓ | ✗ |
Got Questions? We've Got Answers.
See Your Keyword Clusters Come Alive — For Free
No credit card. No signup. Transform keywords into beautiful visual maps instantly.