Turn Google Search Console
Data into Actionable Insights
In Seconds
Visualize your GSC performance: top pages, queries, countries, CTR, and position trends. Get the insights you need without digging through raw data.
Stop drowning in GSC data, start making data-driven SEO decisions
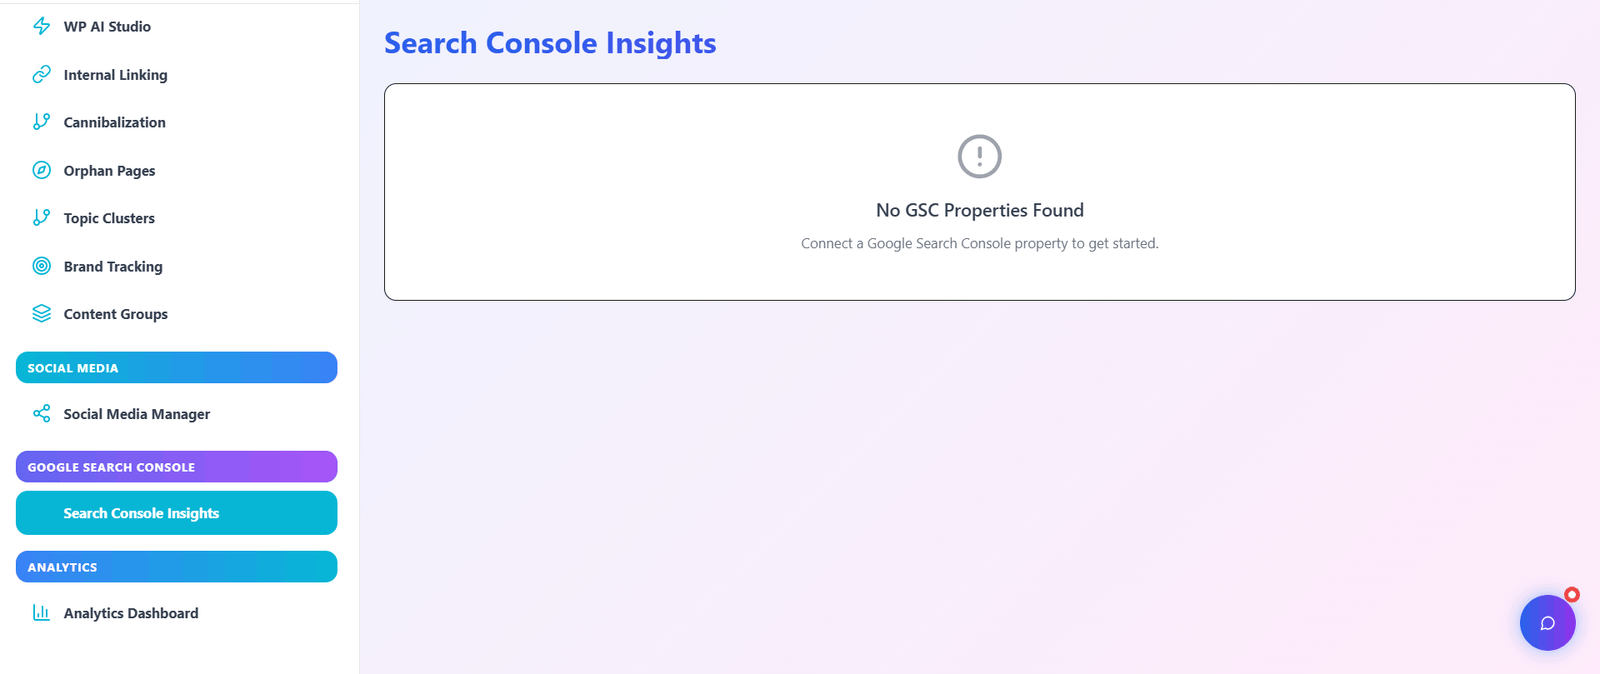
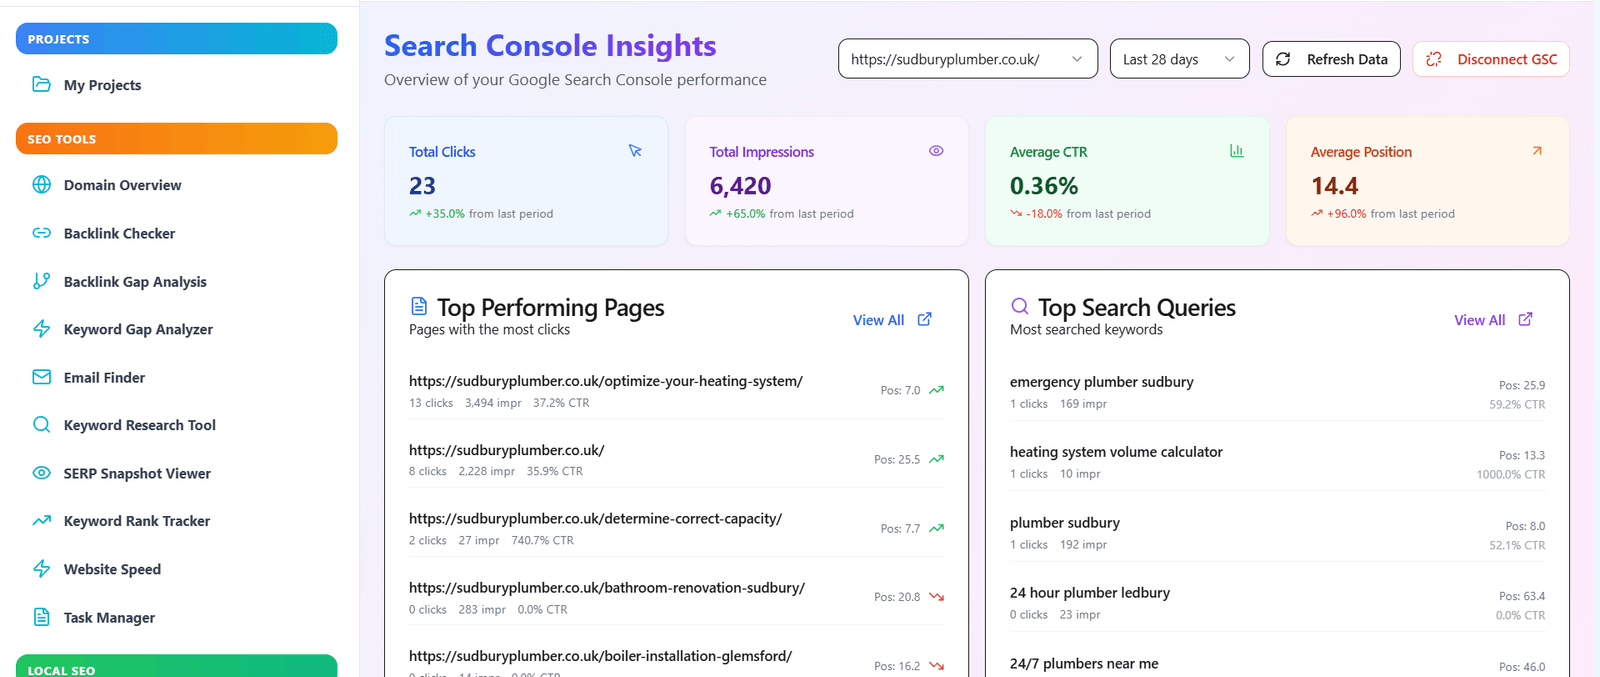
Google Search Console provides powerful data but lacks visualization and trends. Our Insights tool transforms raw GSC metrics into beautiful dashboards showing your top-performing pages, queries, and countries — all with CTR and position trends over time.
Uncover hidden opportunities, track performance changes, and identify exactly where to focus your SEO efforts. No GSC login required — just enter your domain and get instant insights.
Spot trends instantly
Find winning topics
Everything you need from Google Search Console
Beautiful visualizations, actionable insights.
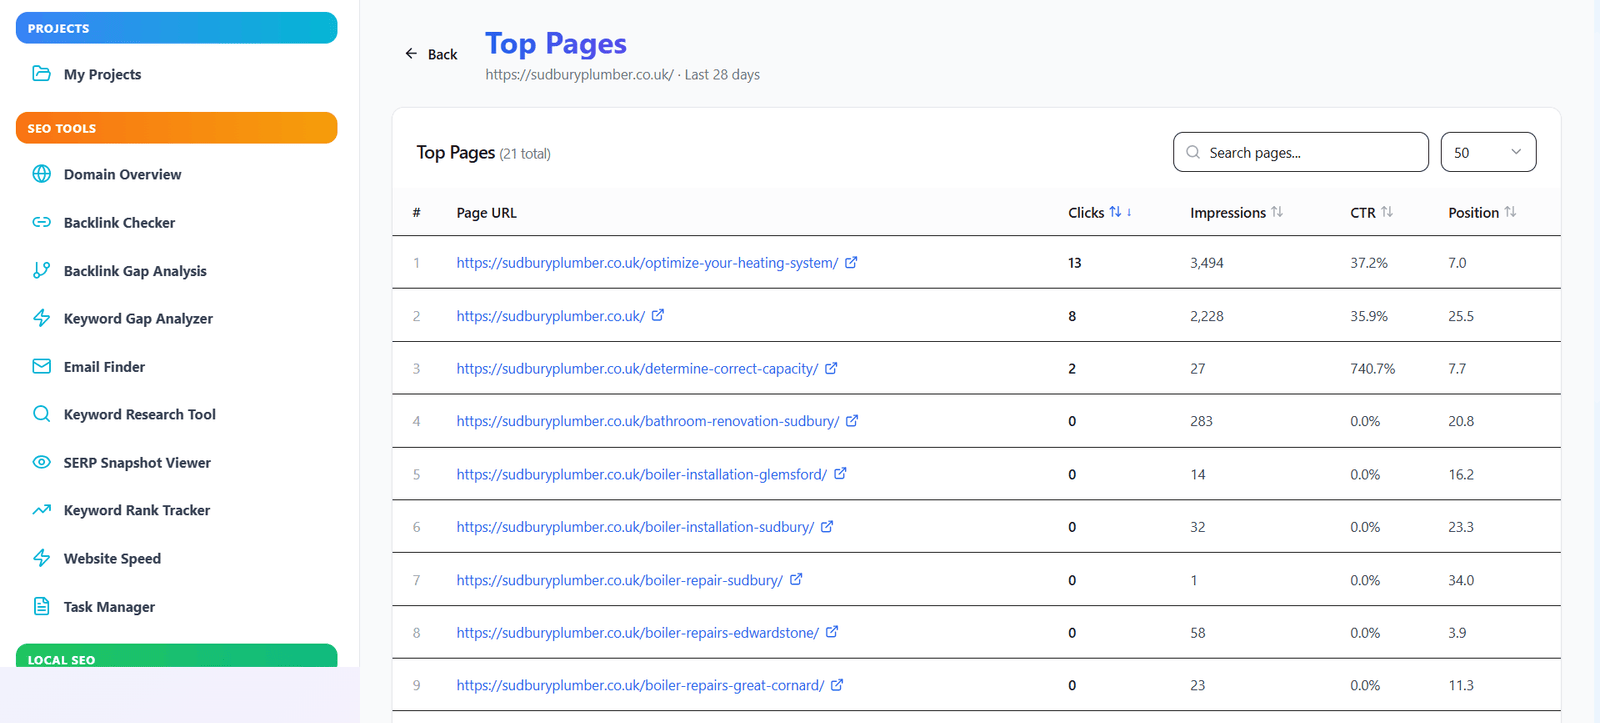
Top Pages Report
See which URLs drive the most clicks and impressions. Sort by clicks, CTR, or position to prioritize optimization.
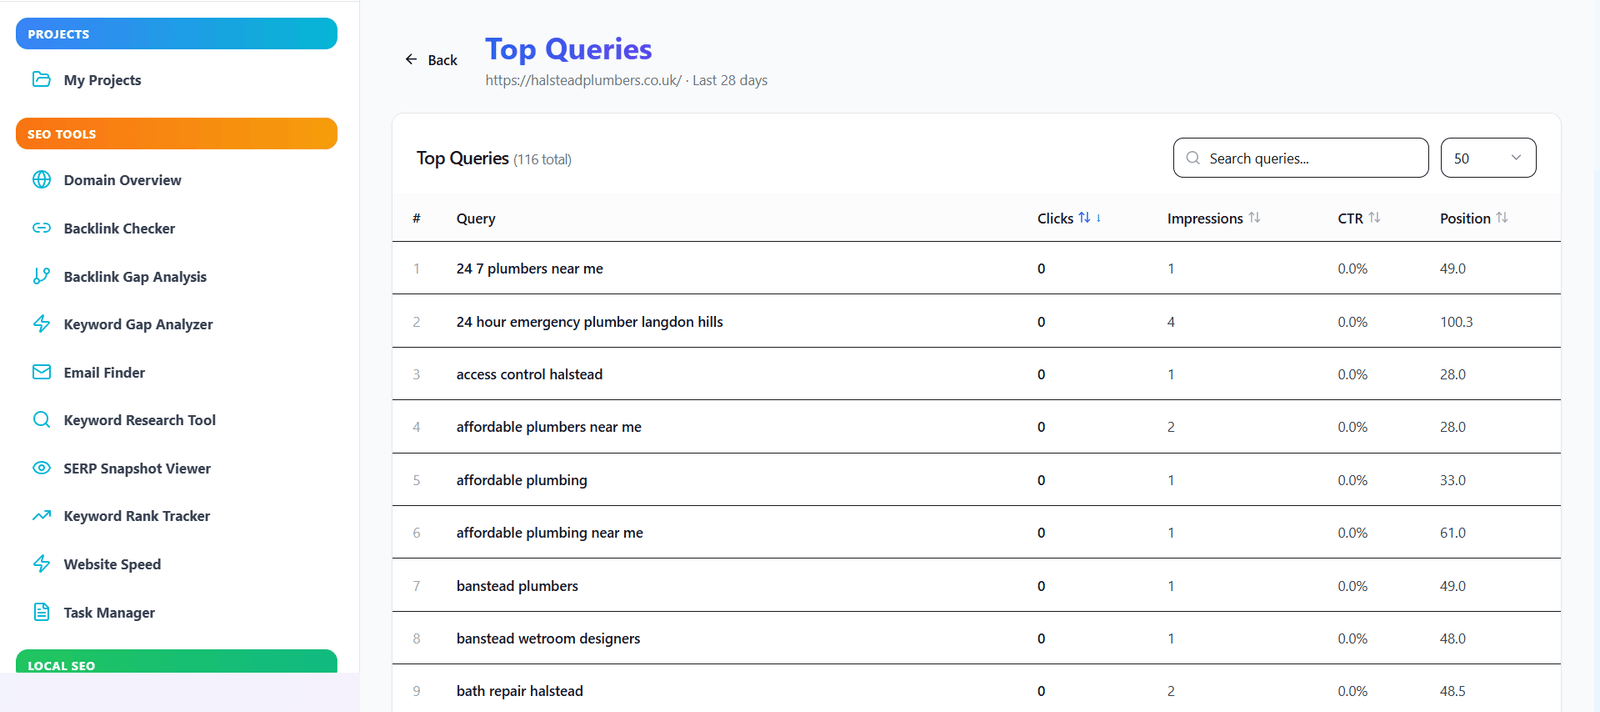
Top Queries Analysis
Discover which keywords bring traffic. Identify high-CTR opportunities and keywords stuck on page 2.
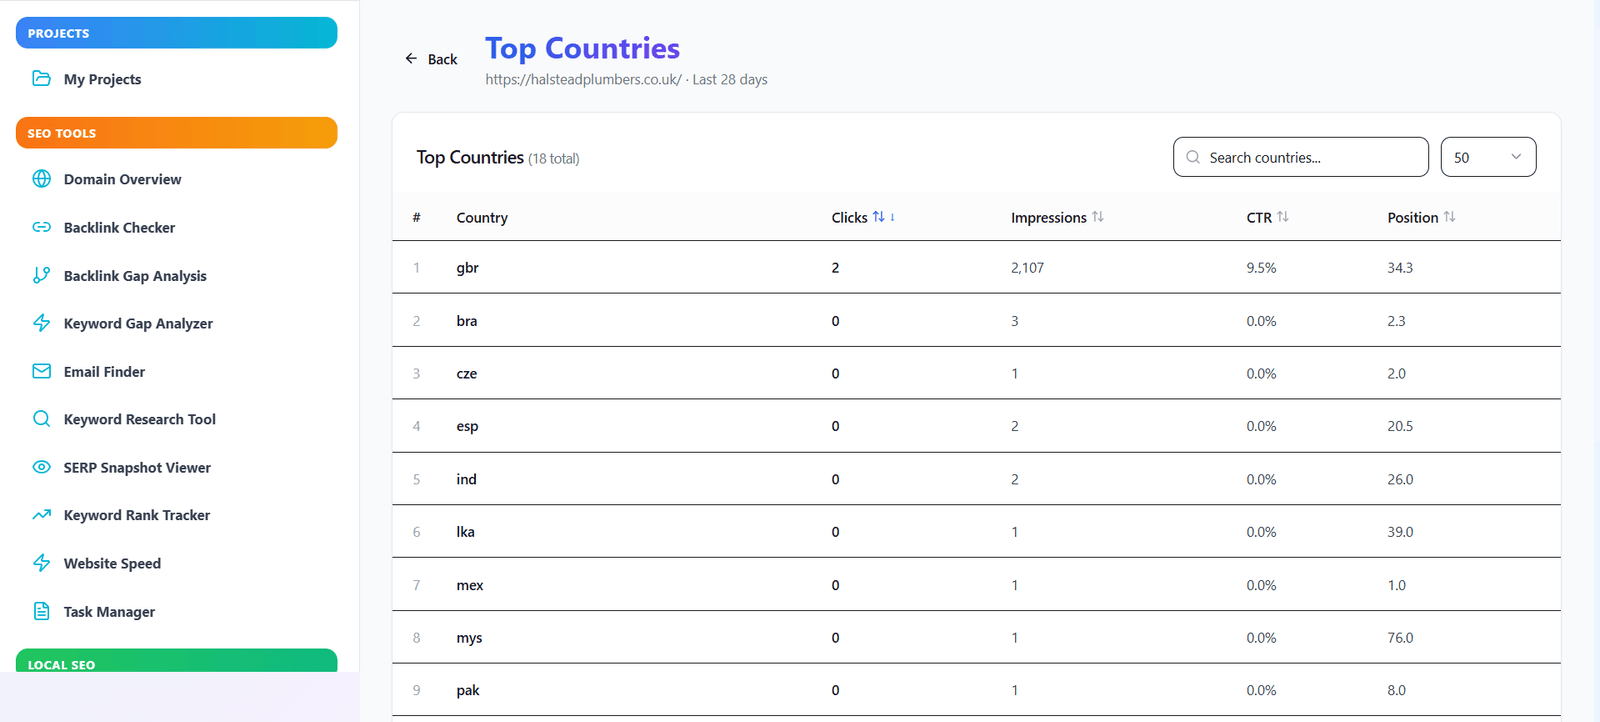
Geographic Performance
See clicks and impressions by country. Identify top-performing regions and untapped markets.
CTR & Position Trends
Track how CTR changes with position. See which pages have high CTR despite lower rankings.
Device Breakdown
Compare performance across mobile, desktop, and tablet. Optimize for your dominant device.
Export to CSV & PDF
Download all insights for client reporting or internal analysis. White-label ready reports.
Date Range Comparison
Compare any two date ranges to measure performance changes. Track algorithm impacts instantly.
Position Distribution
See how many keywords rank in Top 3, Top 10, Top 50. Identify easy wins.
Get GSC insights in under 60 seconds
No Google account needed.
Enter domain
Your website URL
Select date range
Last 7, 28 days or custom
View dashboard
Top pages, queries, countries
Export & act
Download insights, optimize
Transform raw data into revenue-driving insights
Stop exporting CSVs and start understanding your organic performance.
See which pages get impressions but low clicks — fix meta descriptions to boost CTR.
Discover which queries drive the most traffic and conversion potential.
Spot ranking drops or gains immediately with trend lines and comparisons.
See which countries love your content and double down on localized SEO.
Generate beautiful reports showing organic growth, top pages, and keyword wins.
Trusted by SEO pros & agencies
SEO Professionals
- Monitor client performance across thousands of keywords
- Identify ranking opportunities from GSC data
- Track Core Web Vitals impact on CTR
- Find pages with declining impressions
- Benchmark against industry averages
Digital Marketing Agencies
- Generate white-label GSC reports for clients
- Scale performance monitoring across 100+ domains
- Identify top-performing client pages for case studies
- Track algorithm updates across all accounts
- Win new business with data-backed proposals
Content Marketers & Bloggers
- Discover which topics drive the most traffic
- Find keywords to create new content around
- Optimize underperforming posts with low CTR
- Track content refresh success over time
- Identify seasonal traffic patterns
eCommerce & Business Owners
- Track product category page performance
- Identify high-intent shopping queries
- Monitor branded vs non-branded traffic
- Find landing pages with conversion potential
- Optimize for mobile shoppers
Why our GSC Insights beats the native console
Better visualization, faster insights, completely free.
Beautiful visualizations
Charts, graphs, and dashboards instead of raw tables.
No GSC login required
Get insights for any public domain instantly.
Advanced filtering & export
Filter by date, device, country. Download all data.
Compare: Search Console Insights vs alternatives
| Feature | SEOScaleUp ✓ | Native GSC | Expensive Paid Tool ($99+) |
|---|---|---|---|
| Top Pages by Clicks/Impressions | ✓ Visual dashboard | ~ Table only | ✓ Yes |
| Top Queries with CTR & Position | ✓ Ranked & filtered | ~ Basic table | ✓ Detailed |
| Geographic Performance Map | ✓ Interactive map | ✗ Country list only | ✓ Yes |
| Device Breakdown (Mobile/Desktop) | ✓ Separate metrics | ✓ Available | ✓ Yes |
| Date Range Comparison | ✓ Side-by-side | ~ Manual only | ✓ Yes |
| Export to PDF/CSV | ✓ One-click | ✗ CSV only | ✓ Yes |
| No GSC account required | ✓ Any domain | ✗ Own site only | ✗ Own site only |
| Position Distribution Chart | ✓ Visual | ✗ Not available | ✓ Yes |
| White-label reporting | ✓ Free tier | ✗ No | ~ Add-on cost |
Search Console Insights FAQ
Turn Google Search Console data into actionable SEO wins
Join 30,000+ SEOs who use SEOScaleUp to visualize GSC data and make smarter optimization decisions.